
Strykr Analysis
NeutralStrykr Pulse 55/100. Calm surface, but risks are lurking. Threat Level 3/5.
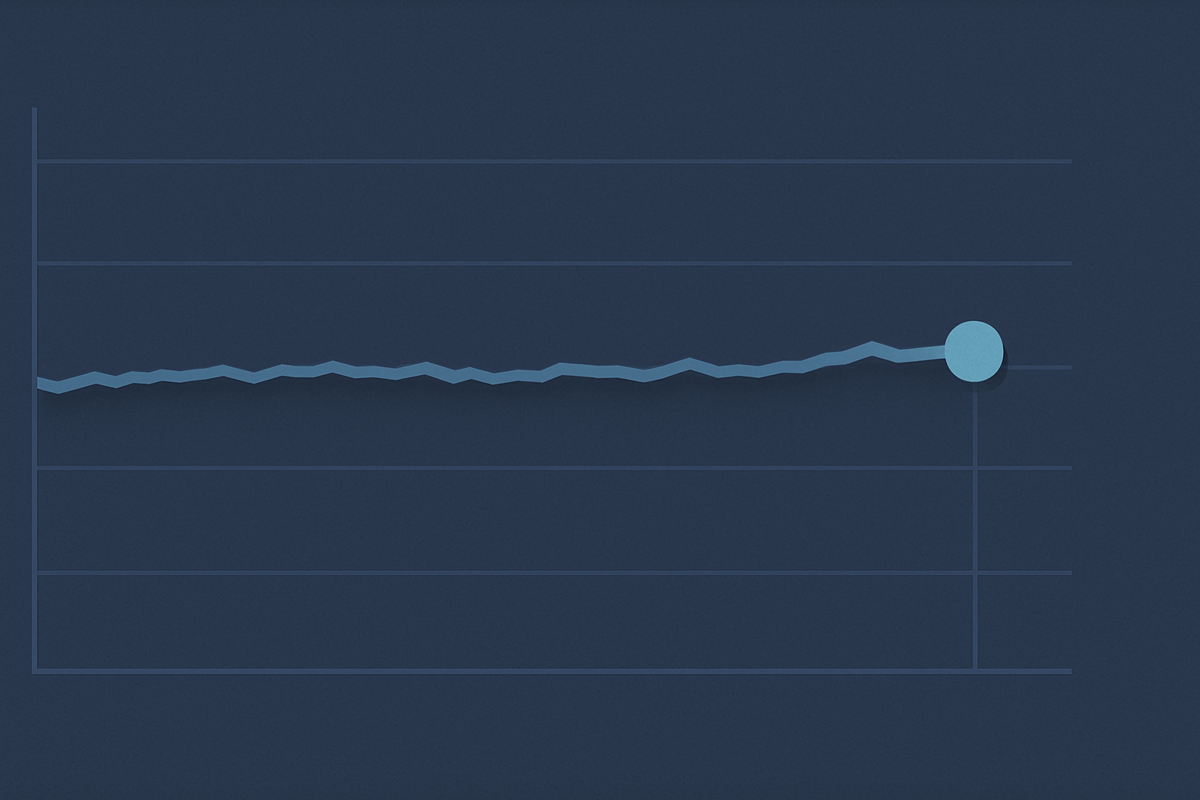
In a week when global markets are acting like caffeine-deprived day traders, jittery, erratic, and prone to sudden mood swings, the South African J20X Index has done the financial equivalent of sitting perfectly still in a hurricane. At $106,285.37, the index is unchanged, unmoved, and apparently unbothered by the chaos swirling around it. For traders used to volatility, this kind of stasis is almost unnerving. Is the J20X signaling resilience, or is it just the eye of the storm before the next big move?
Let’s get the facts straight. As of June 10, 2026, the J20X Index is flat, no change, no drama, just $106,285.37 across the board. This comes as Wall Street futures slip, tech stocks extend losses, and global risk sentiment takes another hit on inflation fears and Middle East tensions (Reuters, WSJ). The contrast is striking. While the Nasdaq is getting tossed around by every CPI whisper, the J20X is serenely holding its ground.
It’s not as if there’s a shortage of risk. Inflation is picking investors’ pockets (WSJ), tech is in retreat, and the only thing more fragile than sentiment is the average retail trader’s margin account. Yet the J20X, which tracks South Africa’s top industrials, is acting like it didn’t get the memo. There’s no sign of panic, no evidence of forced selling, and no hint of the kind of algorithmic mayhem that’s become routine in the U.S. and Europe.
So what gives? Is the J20X a safe haven, or is it just lagging the global risk cycle? Historically, South African equities have been sensitive to global risk-off moves, especially when the rand gets hit and capital flows reverse. But the current setup is different. The rand is stable, commodity prices are off their highs but not collapsing, and local investors seem content to wait out the global storm. There’s a sense that the worst-case scenarios are already priced in, and with no immediate macro shocks on the calendar, the path of least resistance is sideways.
But don’t confuse calm with complacency. The J20X’s stasis is as much a function of low liquidity as it is of genuine resilience. With global investors focused on the U.S. CPI and the Fed’s next move, South Africa is off the radar. That means fewer flows, less volatility, and a market that can go nowhere for days, until it doesn’t. When the dam breaks, it tends to break hard.
Cross-asset correlations are telling. In the past, a sharp risk-off move in global equities would have dragged the J20X lower, but this time, the index is decoupling. That could be a sign of strength, or it could be a setup for a delayed reaction. If global markets stabilize, the J20X could catch a bid as risk appetite returns. If the selloff accelerates, the index could play catch-up in a hurry.
The technicals are, frankly, boring. The index is pinned at $106,285.37, with no meaningful movement in either direction. Support is clustered at $104,000, with resistance at $108,000. Momentum indicators are flat, volume is light, and there’s no sign of directional conviction. It’s a market waiting for a catalyst, and when it comes, the move could be sharp.
Strykr Watch
For traders, the Strykr Watch are clear. Support at $104,000 is critical, if that breaks, look for a fast move to $102,000. Resistance at $108,000 is the first hurdle for any rally, with a bigger wall at $110,000. The index is trading in a tight range, but don’t mistake that for safety. When volatility returns, the move could be violent. RSI is neutral, moving averages are converging, and implied volatility is at multi-month lows. That’s usually the calm before the storm.
The risks are obvious. If global risk sentiment deteriorates further, the J20X is vulnerable to a catch-up selloff. If the rand weakens, capital outflows could accelerate, putting downward pressure on the index. And if commodity prices roll over, South Africa’s industrials will feel the pain. The lack of liquidity means that any move could be exaggerated, with gaps and air pockets waiting to be filled.
But there are opportunities here, too. If the index holds $104,000 and global markets stabilize, there’s room for a relief rally back to $108,000 and beyond. For nimble traders, range-bound strategies can work, buy support, sell resistance, keep stops tight. If you’re betting on a breakout, wait for confirmation, a close above $108,000 or below $104,000 should set the stage for the next big move.
Strykr Take
The J20X Index is the market’s version of Schrödinger’s cat, alive and dead at the same time. The calm could be a sign of underlying strength, or it could be the prelude to a sharp move when global volatility returns. For now, respect the range, trade the levels, and be ready to move fast when the market wakes up. The next catalyst will decide whether this is resilience or just inertia.
datePublished: 2026-06-10 10:45 UTC
Sources (5)
Inflation Is Picking Investors' Pockets
Plus, an exodus from tech stocks
Wall St futures slip as tech losses mount ahead of key inflation data
U.S. stock index futures fell on Wednesday as technology stocks extended losses, while renewed tensions between the U.S. and Iran weighed on sentime
Trump Regulator Proposes New Rules on What's Allowed on Prediction Markets
The CFTC will provide clearer parameters around what bets are allowed on Kalshi and other platforms, but won't ban certain contracts.
Dow futures edge down as investors focus on US inflation
US stock futures traded lower during European hours on Wednesday as investors assessed escalating geopolitical tensions in the Middle East and prepare
The Cloud Has Come Back Down To Earth
The cloud has come back to Earth. In 2021, the metrics that defined growth were subscriptions, ad impressions, and active users.